Lean Analytics: A Product Manager's Guide to Data-Driven Decisions
TL;DR: Lean Analytics
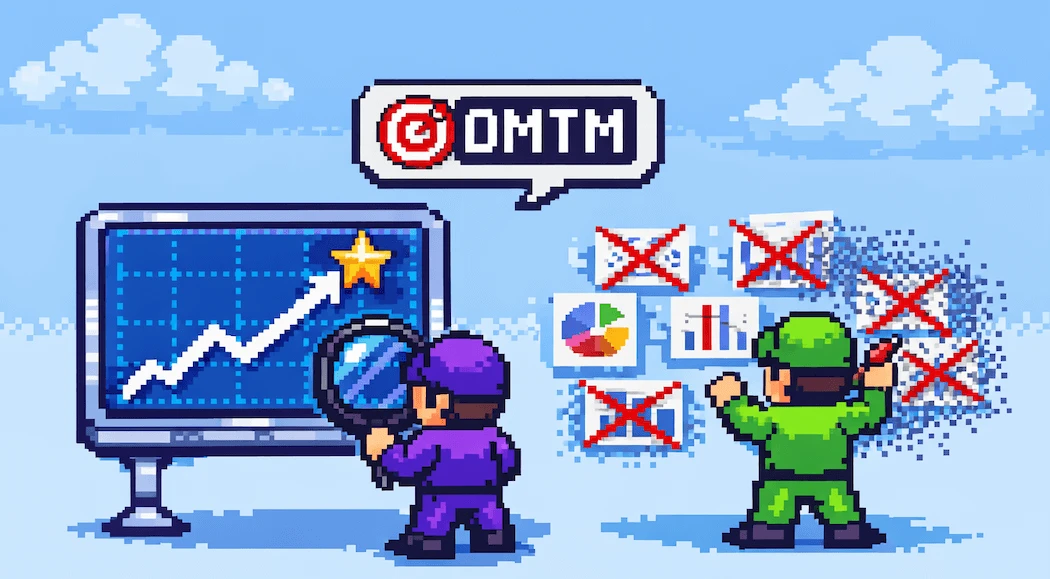
- Core idea: Track the One Metric That Matters (OMTM) at each business stage instead of drowning in data
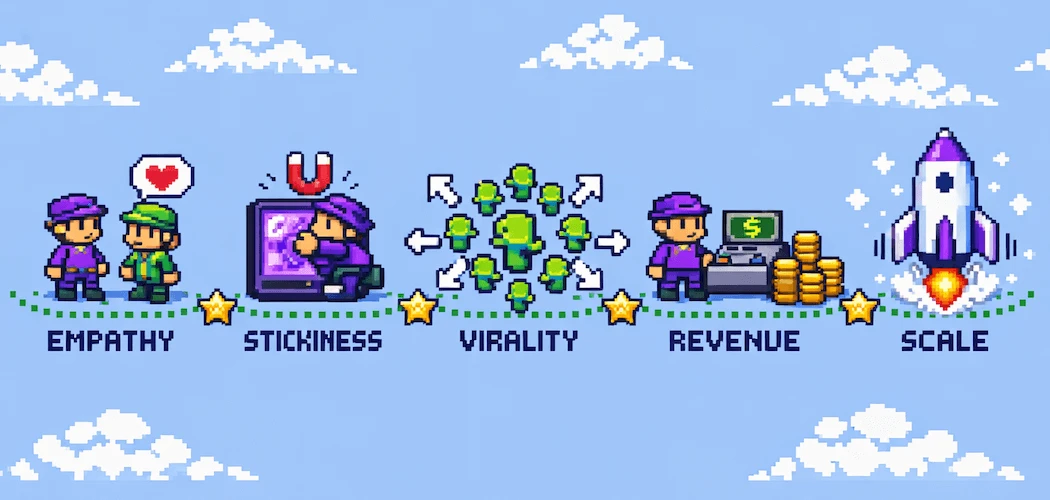
- Five stages: Empathy → Stickiness → Virality → Revenue → Scale
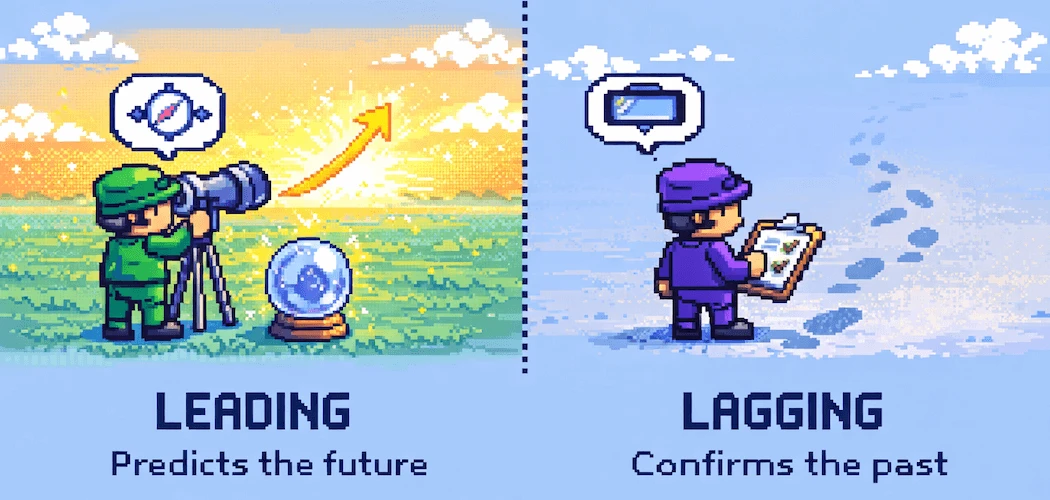
- Key principle: Leading indicators predict the future; lagging indicators confirm the past
- Bottom line: Good analytics help you measure what creates value, not just what's easy to track
Lean Analytics is a framework for using data to build better products faster. Developed by Ben Yoskovitz and Alistair Croll, it applies lean startup principles to analytics: measure what matters, learn quickly, and iterate based on evidence rather than assumptions.
"There is one metric that really helps drive your entire business and it will change over time. It's not one metric that you measure your entire business by forever because your business from idea to scale is going to change radically." Ben Yoskovitz, Co-author of Lean Analytics
For product managers, Lean Analytics solves a critical problem: knowing which metrics actually matter at each stage of your product's lifecycle. This guide covers the core concepts from the book, enriched with insights from conversations with Ben Yoskovitz and other analytics experts.
What is Lean Analytics?
Lean Analytics is an approach to measuring business success that emphasizes focus, learning, and iteration. The book Lean Analytics, published in 2013, builds on Eric Ries's Lean Startup methodology by providing a practical framework for what to measure and when.
The core philosophy rests on three principles:
- Focus on one metric at a time. Rather than tracking everything, identify the single metric that matters most right now.
- Match metrics to your stage. What you measure should change as your business evolves from idea to scale.
- Use data to learn, not just report. Good analytics drive decisions, not just dashboards.
This approach connects directly to product discovery. Before you can measure success, you need to understand what problem you're solving and for whom. Lean Analytics provides the measurement framework that validates your discovery work.
The One Metric That Matters (OMTM)
The OMTM is the central concept in Lean Analytics. It's the single metric that captures the core value your product creates at your current stage.
Why focus on just one metric? Because focus creates clarity. When everyone in the organization knows what success looks like, decisions become easier and alignment improves.
"If you understand the value you're creating, measuring it should be pretty straightforward." Ben Yoskovitz
How to Identify Your OMTM
Your OMTM should answer: "If this number improves, does the business get meaningfully better?" Follow this process:
- Identify your current stage. Are you validating a problem, proving engagement, or scaling revenue?
- Determine what matters most now. Early stage: engagement and retention. Growth stage: acquisition and virality. Mature stage: revenue and efficiency.
- Pick a metric you can actually influence. If your team can't move the needle, it's the wrong metric.
- Set a target. "Improve DAU" isn't specific. "Increase DAU from 1,000 to 5,000" is.
OMTM Examples by Business Type
| Business Type | Early Stage OMTM | Growth Stage OMTM |
|---|---|---|
| SaaS | Activation rate | Monthly Recurring Revenue |
| E-commerce | Conversion rate | Revenue per visitor |
| Media/Content | Time on site | Engaged visitors |
| Marketplace | Liquidity (matches made) | Gross Merchandise Value |
| Mobile App | Day 7 retention | Daily Active Users |
Your OMTM will evolve. What matters when you have 100 users differs from what matters at 100,000 users. The key is choosing the right metric for where you are now, not where you want to be. For more on metric types, see my guide on product KPIs.
The Five Stages of Lean Analytics
Yoskovitz and Croll define five stages that most businesses move through. Each stage has different priorities and metrics.
| Stage | Focus | Key Question | Primary Metrics |
|---|---|---|---|
| 1. Empathy | Problem validation | Is this a real problem worth solving? | Interview insights, problem frequency |
| 2. Stickiness | Engagement | Are people using the product repeatedly? | Retention, session frequency, DAU/MAU |
| 3. Virality | Growth | Are users bringing other users? | Viral coefficient, referral rate |
| 4. Revenue | Monetization | Can we make money? | Conversion rate, ARPU, LTV |
| 5. Scale | Efficiency | Can we grow profitably? | CAC payback, unit economics |
Stage 1: Empathy
Before building anything, validate that the problem exists and matters. This stage relies heavily on qualitative data: customer interviews, observation, and problem frequency analysis.
The key metric at this stage isn't quantitative. It's the conviction that you've found a problem worth solving. Many teams skip this stage and jump straight to building, which leads to products nobody wants.
Stage 2: Stickiness
Once you have a product, the question becomes: do people actually use it? Stickiness measures engagement and retention.
If users try your product once and never return, you don't have product-market fit yet. Focus on retention before growth. A leaky bucket doesn't benefit from more water. This stage directly connects to product-market fit.
Stage 3: Virality
With proven engagement, you can invest in growth. Virality measures whether your product spreads organically.
The viral coefficient (K) tells you how many new users each existing user brings. K > 1 means exponential growth. K < 1 means you'll need paid acquisition to grow.
Stage 4: Revenue
Now you prove the business model works. Can you convert engaged users into paying customers at a sustainable rate?
Key metrics include conversion rate, average revenue per user (ARPU), and customer lifetime value (LTV). The goal is proving you can monetize the value you've created.
Stage 5: Scale
With proven revenue, you optimize for efficiency and profitability. The question shifts from "Can we make money?" to "Can we make money efficiently?"
Metrics like customer acquisition cost (CAC) payback period and unit economics become critical. You're building a machine that can grow sustainably.
Business Model Archetypes
Lean Analytics identifies six common business model archetypes. Each has different metrics that matter.
E-commerce
Revenue comes from selling products directly. Key metrics: conversion rate, cart abandonment rate, average order value, repeat purchase rate.
SaaS (Software as a Service)
Recurring subscription revenue. Key metrics: MRR, churn rate, expansion revenue, activation rate.
Free Mobile App
Monetization through ads or in-app purchases. Key metrics: DAU, session length, ad engagement, in-app purchase rate.
Media Site
Monetization through advertising. Key metrics: page views, unique visitors, time on site, ad click-through rate.
User-Generated Content
Value from user contributions (think Wikipedia or Reddit). Key metrics: contribution rate, content quality, engagement per piece of content.
Two-Sided Marketplace
Connecting buyers and sellers. Key metrics: liquidity, transaction volume, take rate, buyer/seller ratio.
Understanding your business model helps you choose the right metrics. A SaaS company obsessing over page views is measuring the wrong thing. Your product strategy should drive your analytics strategy.
Leading vs. Lagging Indicators
One of the most important distinctions in analytics is between leading and lagging indicators.
"What is happening today in your product, on your website, in your service that tells you what's going to happen in the future. Everybody tracks lagging indicators. It does tell you what has happened. The leading indicators do predict the future." Ben Yoskovitz
Lagging indicators tell you what already happened. Revenue, churn, and NPS are lagging indicators. They confirm outcomes but can't predict them.
Leading indicators predict future outcomes. Feature adoption, activation rate, and engagement patterns are leading indicators. They give you time to course-correct before problems appear in lagging metrics.
| Lagging Indicator | Leading Indicator |
|---|---|
| Revenue | Pipeline value, demo-to-close rate |
| Churn rate | Support ticket volume, login frequency |
| Customer lifetime value | Feature adoption, expansion conversations |
| NPS score | Task completion rate, time to value |
The best analytics strategies combine both. Lagging indicators confirm you're on track. Leading indicators help you predict and prevent problems.
This concept directly applies to goal-setting frameworks. When defining OKRs, include both leading and lagging indicators to create a complete picture.
Vanity Metrics vs. Actionable Metrics
Not all metrics are created equal. Vanity metrics make you feel good but don't drive decisions. Actionable metrics tell you what to do next.

"Vanity metrics make us feel good, but they don't move the needle." Ben Yoskovitz
"Just because you can track something doesn't mean you should." Adam Greco, Product Analytics Expert
Common Vanity Metrics
- Total registered users: Impressive number, but how many are active?
- Page views: High traffic means nothing if nobody converts.
- App downloads: Downloads without activation are meaningless.
- Social media followers: Followers who don't engage provide no value.
Converting Vanity to Actionable
Vanity Metric
Actionable Alternative
Total users
Active users (DAU/WAU/MAU)
Page views
Conversion rate by traffic source
Downloads
Day 7 retention rate
Email list size
Email engagement rate
Time on site
Task completion rate
The test for actionability: "If this metric changes, do I know what to do about it?" If the answer is no, you're probably tracking a vanity metric.
How to Apply Lean Analytics as a PM
Here's a practical framework for implementing Lean Analytics in your product work.
"You need success metrics based on facts. Otherwise you can't argue or justify anything." Matthias Kluge, Product Lead
Step 1: Identify Your Stage
Be honest about where you are. Most products that fail do so because teams think they're at Stage 4 (Revenue) when they're actually at Stage 2 (Stickiness). If users aren't returning, acquisition won't save you.
Step 2: Choose Your OMTM
Based on your stage, identify the single metric that matters most. Write it down. Make sure everyone on the team knows it.
Step 3: Set a Target
Your OMTM needs a goal. "Improve retention" is vague. "Increase Day 7 retention from 25% to 40%" is specific and measurable.
Step 4: Identify Leading Indicators
What behaviors predict your OMTM? If your OMTM is retention, leading indicators might include feature activation, session frequency, or time to first value.
Step 5: Build a Simple Dashboard
Track your OMTM, its leading indicators, and 2-3 supporting metrics. Resist the urge to add more. Complexity kills focus.
Step 6: Review and Iterate
Check your metrics weekly. Ask: Are we making progress? Are we tracking the right things? When your OMTM hits its target, it's time to move to the next stage and choose a new OMTM.
This process connects directly to how you measure success in OKRs vs KPIs.
Common Mistakes to Avoid
After years of working with analytics, here are the mistakes I see most often:
Tracking Everything
Modern analytics tools make it easy to track hundreds of events. Don't. More data creates more noise. Focus on the metrics that drive decisions.
Ignoring Qualitative Data
Numbers tell you what's happening but not why. Combine quantitative analytics with customer interviews, usability testing, and support ticket analysis.
Not Iterating on Metrics
Your metrics should evolve as your product evolves. The metrics that mattered at launch won't be the same metrics that matter at scale. Review your analytics strategy quarterly.
Optimizing the Wrong Metric
It's easy to improve a metric that doesn't matter. Before optimizing, ask: "If we 10x this metric, does the business meaningfully improve?" If not, find a better metric.
Skipping the Empathy Stage
The most common mistake is building before validating. All the analytics in the world can't save a product that solves a problem nobody has.
Conclusion
Lean Analytics provides a framework for using data to build better products. The key principles are simple: focus on one metric at a time, match metrics to your stage, and use data to learn rather than just report.
Start by identifying your current stage and choosing your One Metric That Matters. Build a simple dashboard that includes both leading and lagging indicators. Review weekly and iterate.
The goal isn't perfect data. It's better decisions. As Ben Yoskovitz puts it: if you understand the value you're creating, measuring it should be straightforward.
If you want a structured way to pick your One Metric That Matters and build the right dashboard for your stage, that is exactly the kind of brief I take inside my product analytics coaching. I am also happy to compare notes on LinkedIn about your approach.